What is left-over from such a catastrophic event, is a black hole or a neutron star, formed from the matter of the star's central region. In a neutron star, the iron nuclei are squeezed together to form what is essentially a plasma of neutrons. Like a figure scater doing a pirouette spins faster when (s)he brings the arms close to the body, due to the conservation of angular momentum, the collapse of the slowly rotating progenitor star results in the neutron star to spin with periods of 1 second and faster.
During the final collapse, the magnetic fields of the star are also squeezed into a small volume, thus the field strength at the surface of the neutron star is extremely high: about 1010 Tesla, while our Sun has a field of about 10-4 Tesla! Because of the rapid rotation the rapidly changing strong magnetic fields induce a huge electric field of about 1011 V/m, which easily overcomes the gravitational pull on charged particles, and electrons and positrons are pulled away from the neutron star's surface. As charged particles can only move in a spiral path around and along the curved magnetic field lines, they are pulled into higher regions of lower density. Their curved path also causes them to radiate electromagnetic waves which comes out in a narrow cone parallel to the magnetic field lines. Thus the radiation is concentrated in a direction of the magnetic axis.
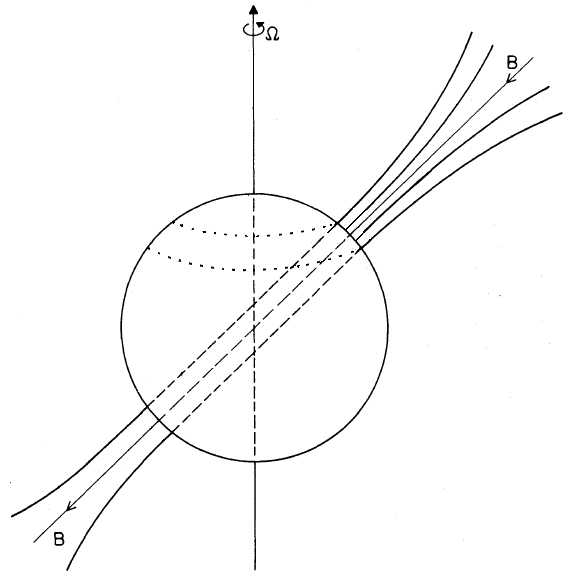
If the magnetic axis is inclined with respect to the rotation axis, the neutron star sends out beams of radiation, from its magnetic north and south poles. Due to the rotation, the beams point to two large circles in space, just like the light beam of a lighthouse.
Schematic sketch of a neutron star rotating about the Ω-axis, but with an inclined magnetic axis, indicated by the field lines B near the magnetic poles. Electrons and positrons move along the field lines and produce beams of radiation in both directions of the magnetic axis. The star's rotation takes these beams around (adapted after Ruderman and Sutherland, 1975).
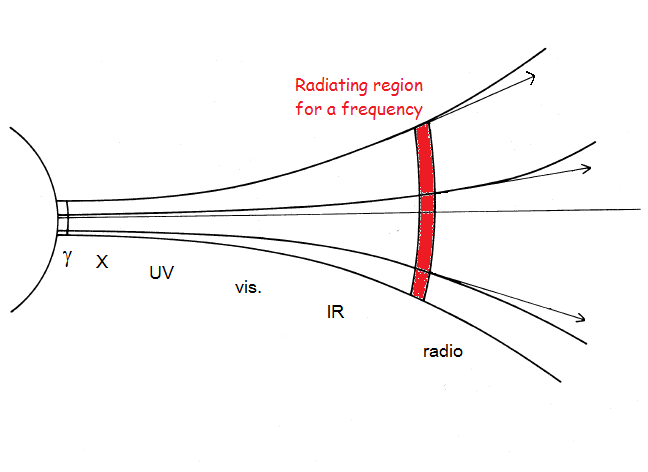
As the charged particles move into regions high above the neutron star's surface where the density is lower, their radiation is centered at lower frequencies. In this way they produce radiation over a wide range of frequencies (from the X-rays to radio waves), as they travel through the neutron star's magnetosphere.
|
|
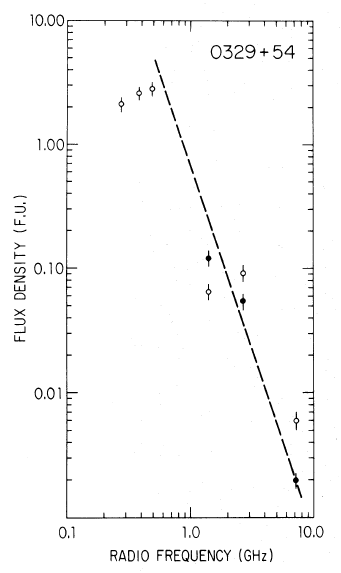
The frequency of the radiation which is produced in a zone depends on the height above the neutron star's surface: γ and X rays are produced close to the surface, radio waves at greater heights, where the density is lower (adapted after Ruderman and Sutherland, 1975). | The radio flux density of the pulsar B0329+54 decreases with frequency (from Backer and Fisher, 1974; 1 f.u. (flux unit) = 1 Jy). |
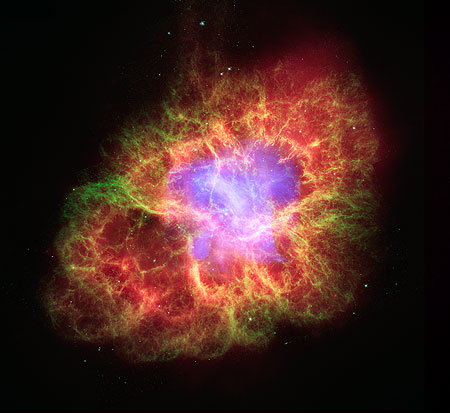
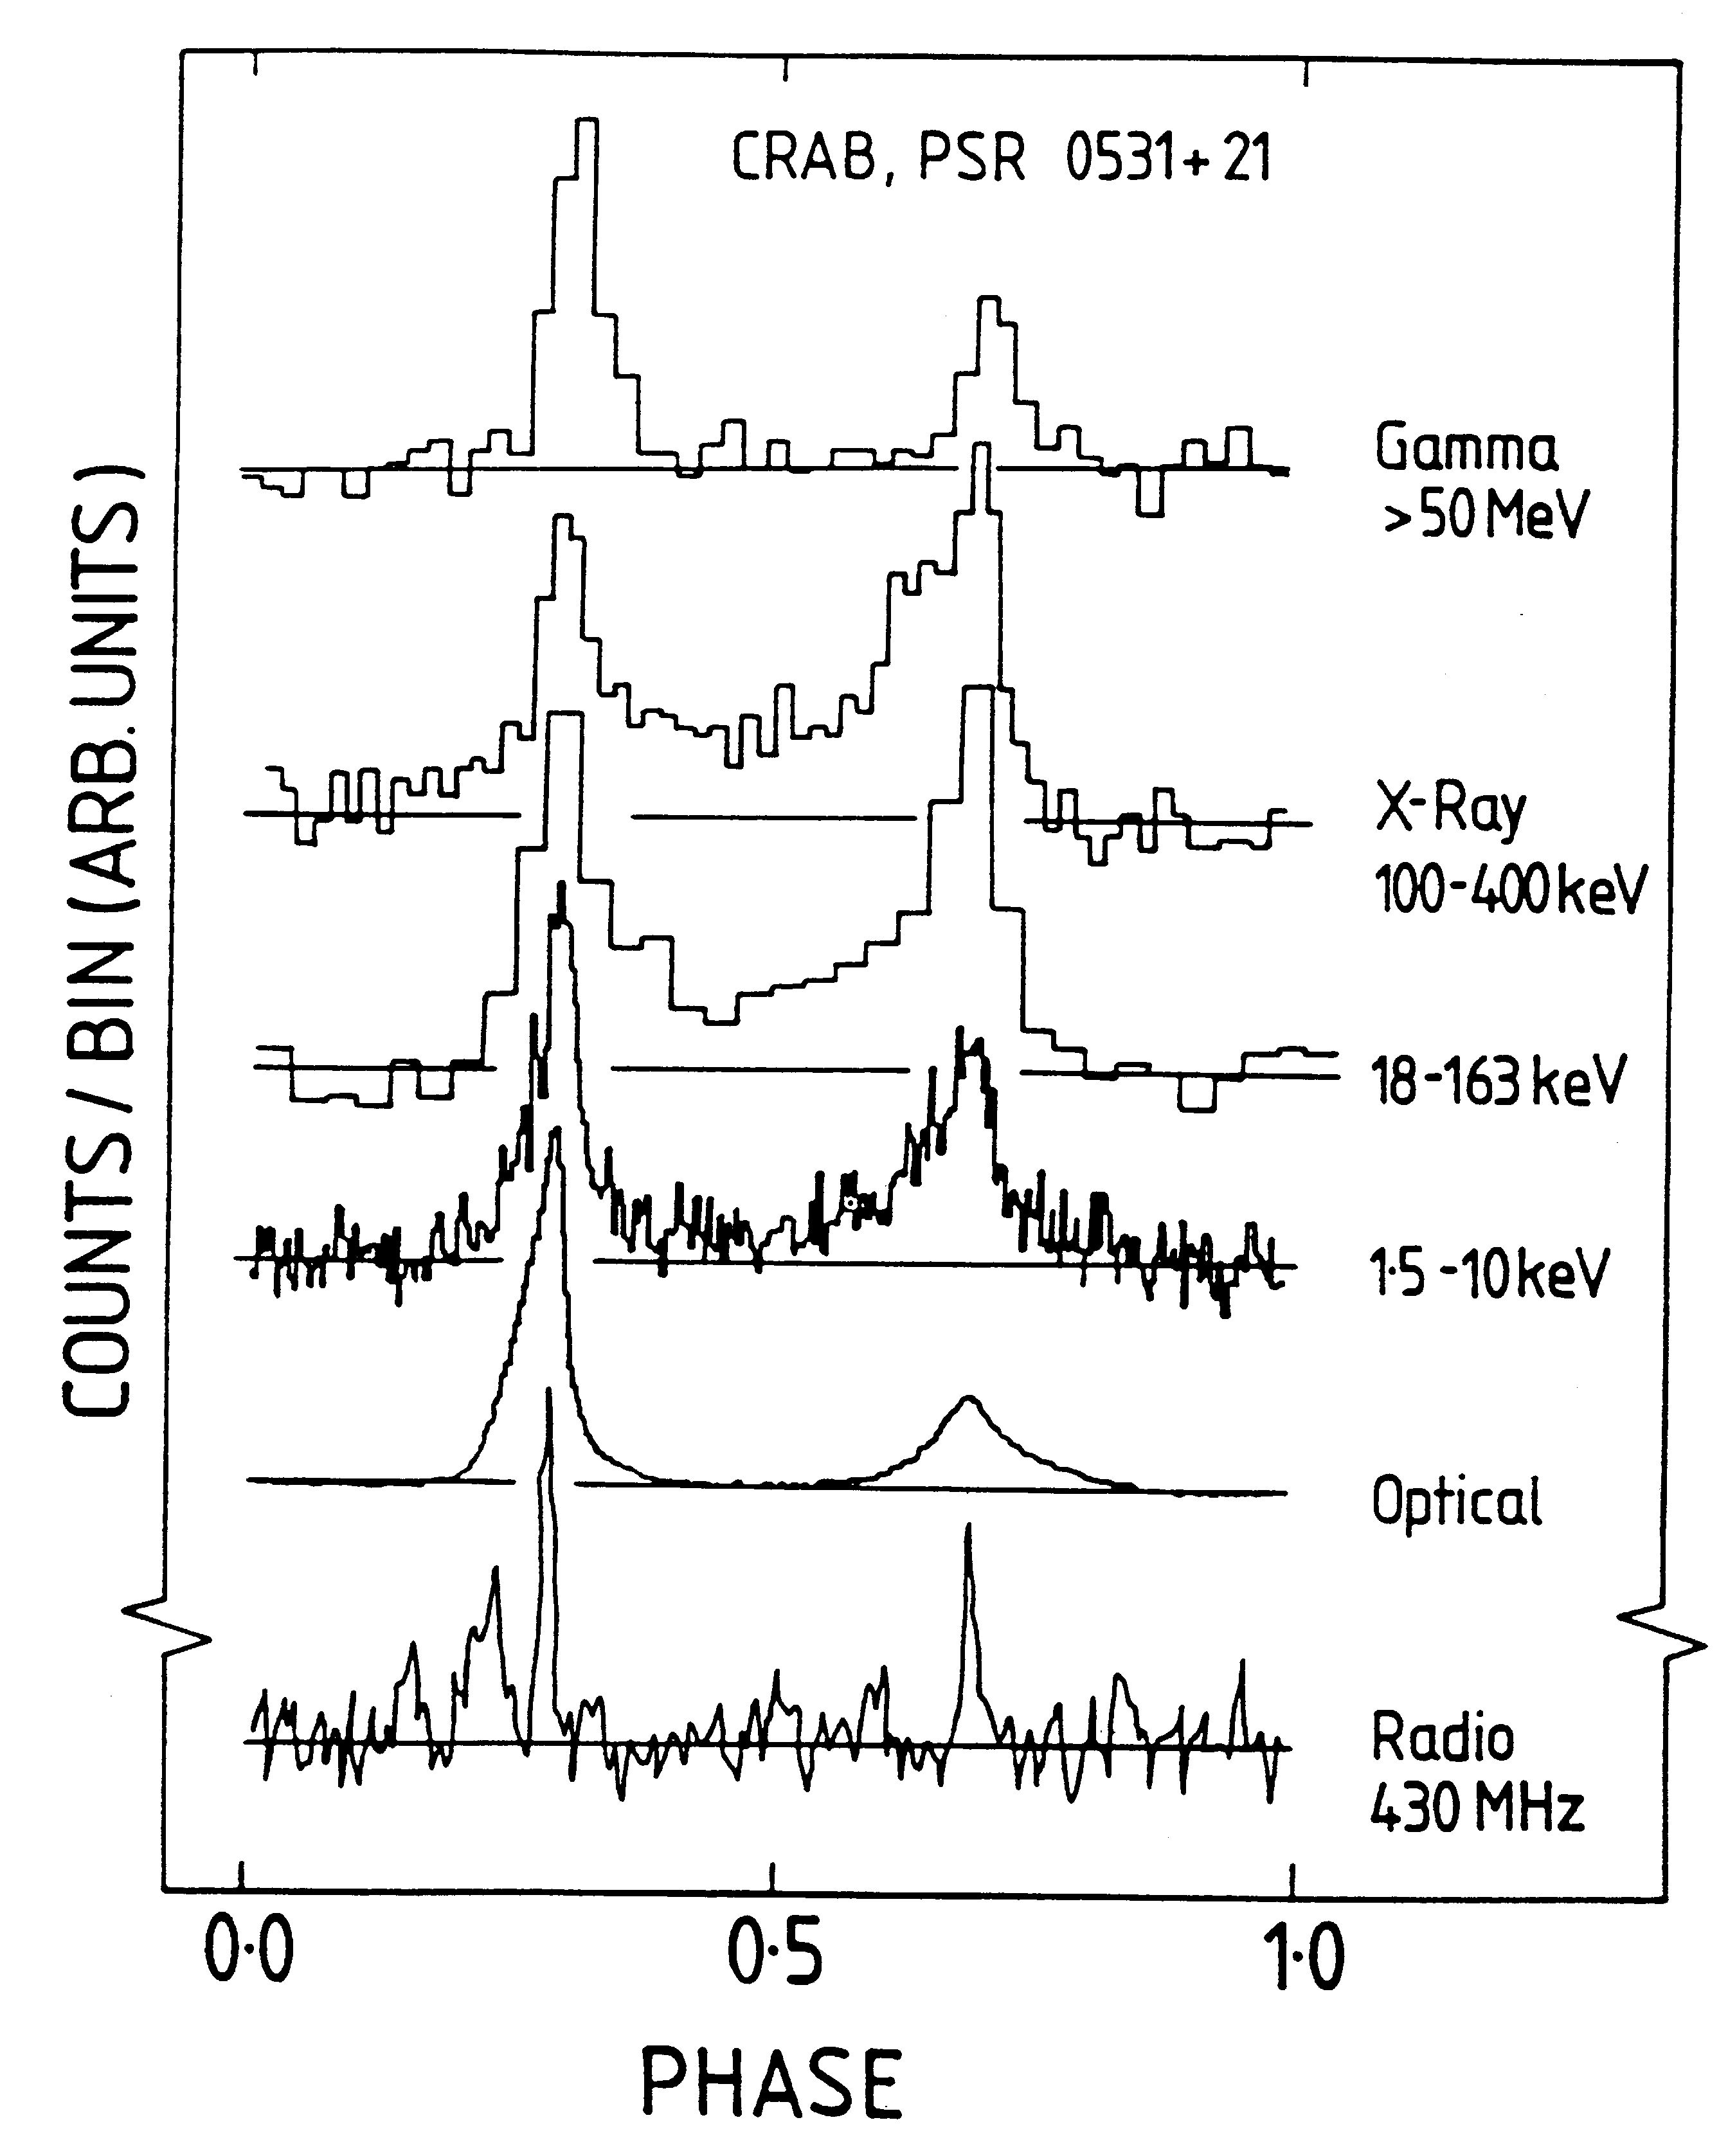
If our Earth happens to be in a direction towards which this beam may point, we observe a periodic flash of radiation: a pulsar. A famous pulsar is in the centre of the Crab nebula:
|
|
The Crab nebula, the gaseous left-over of a supernova explosion. This is both gas ejected by the dying star and gas filaments formed by the collision with the ambient interstellar gas. The composite image shows the emission in the X-rays from synchrotron radiation (blue) and by emission lines in the optical (green) and infrared (red). | In the centre of the nebula there is the Crab pulsar, which emits radiation pulses in the whole range from γ-rays and X-rays to radio waves, with a period of 0.0333 s |
See here for more Technical Details about Pulsar Observations at DL0SHF
Jodrell Bank Observatory has a very nice collection of the
Sounds of Pulsars.
|
|
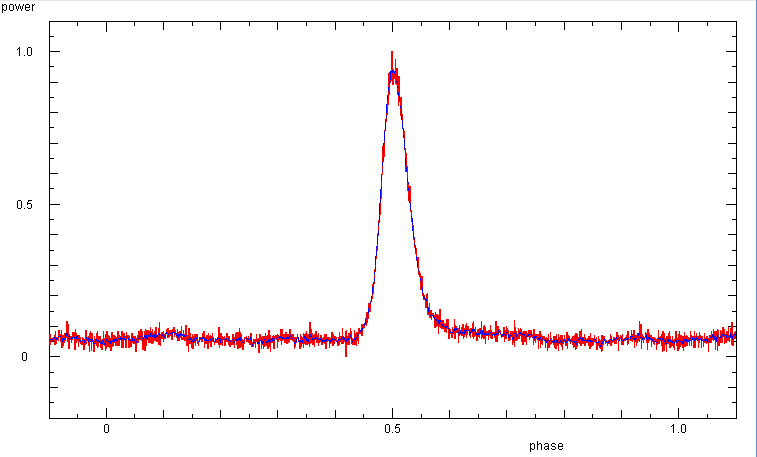
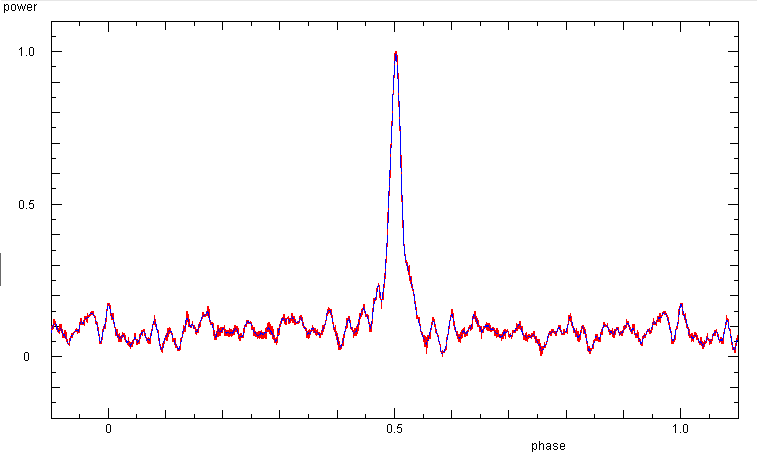
Phase diagram (or folded light curve) from the last 8 min part from an observation on 2 nov 2014 with a sampling rate of 1 kHz. The 'old' instrument configuration with the HP437B power meter has a response time of 50 ms, which broadens the pulse. | Phase diagram from 6.5 min of data, averaged over 10 samples taken at 30 kHz rate. This was done on 30 sep 2015, with the 'new' instrument configuration of a EP441 power meter. With the better time resolution the main pulse is sharper, and the subpulses before and behind the main pulse are discernible. |
|
|
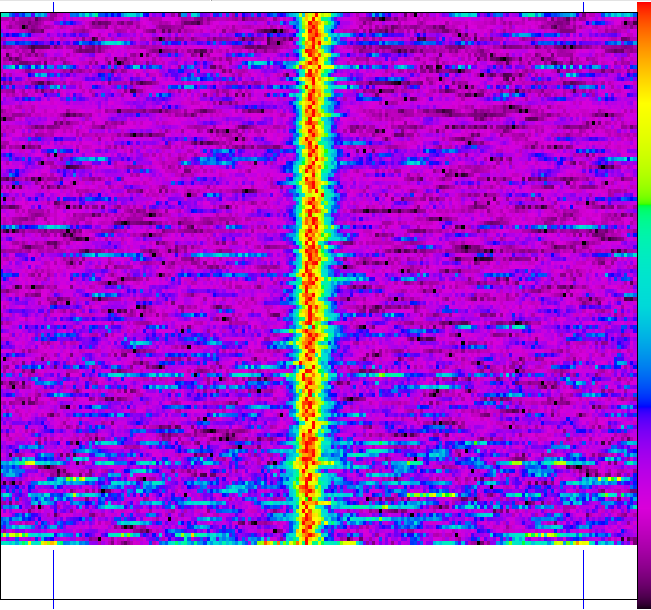
Waterfall plot of the data of 2 nov 2014. | Waterfall plot of the data of 30 sep 2015. |
|
|
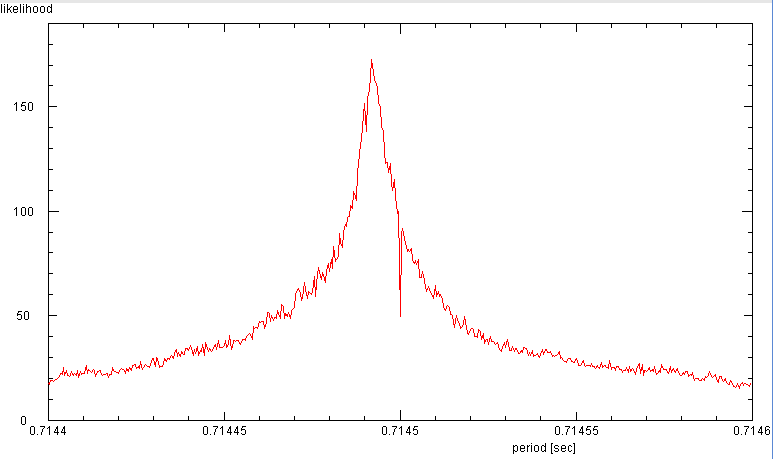
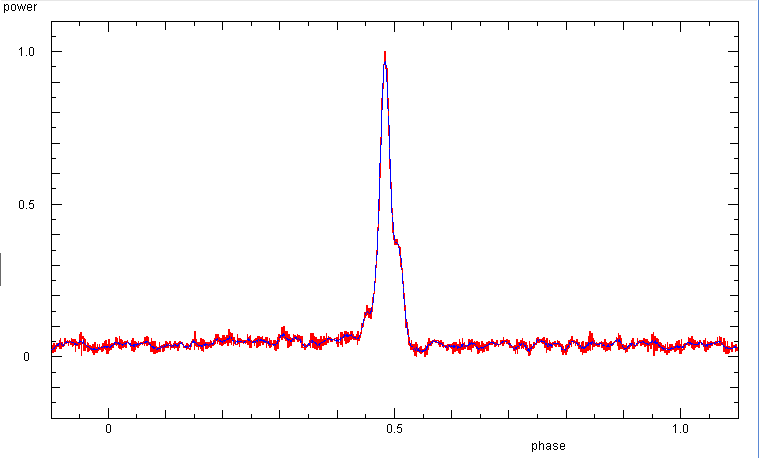
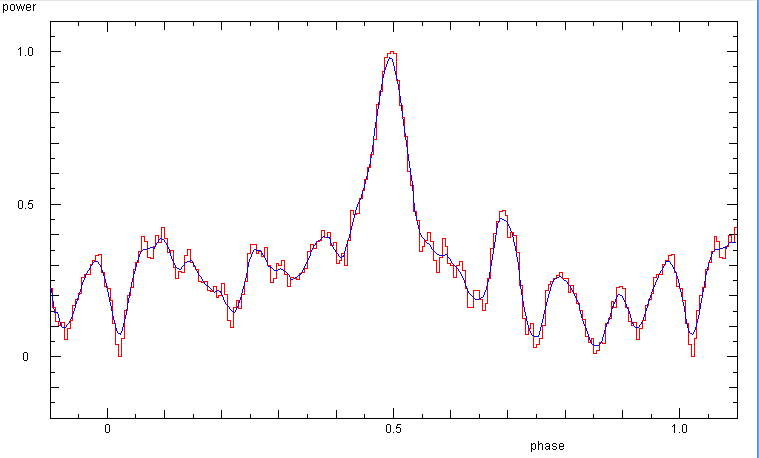
In a 2 hour section with high signal to noise from 26 oct 2015, the period of B0239+54 is found to 0.714492 s. Data was taken with 40 kHz sampling rate and the averages were recorded at 500 Hz. | The phase diagram shows the weak sub-pulses before and after the main pulse. |
|
|
Searching for the period of B0950+08: The faint signal requires many data. The search for the period needs to be confined in a narrow range, as only the exact period will make a reasonable phase diagram. The best fit is found with the period of 0.25305 s. | Phasediagram of B0950+08 for a period of 0.25305 s. |

|
|
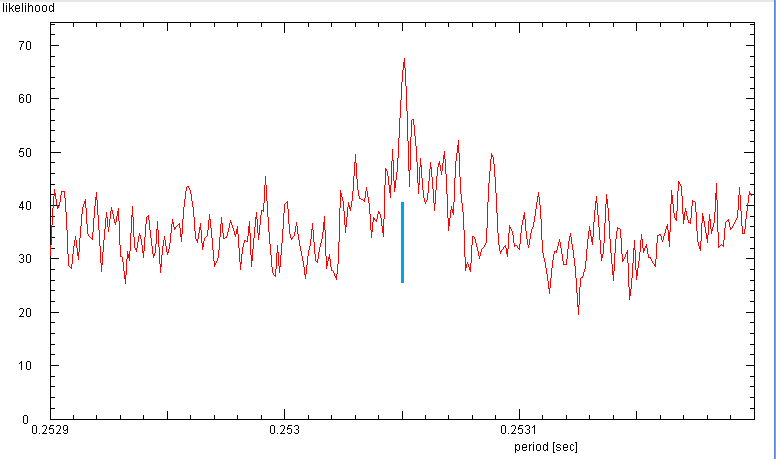
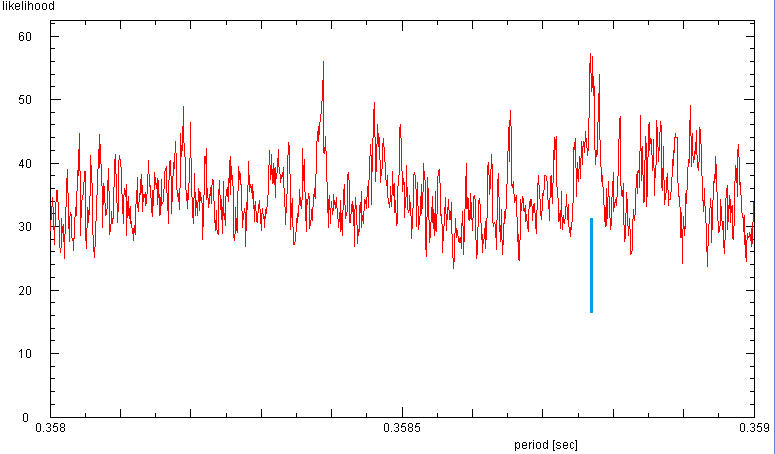
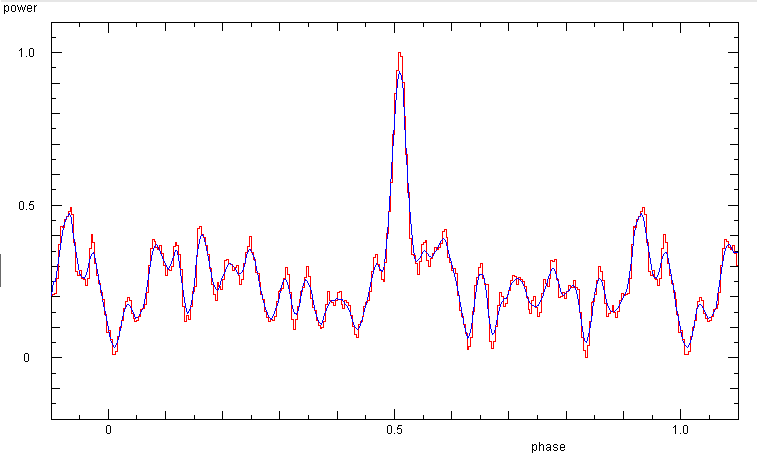
Search for the period of B1933+16: Again, the search range needs to be rather small around the expected value. The quite prominent peak at 0.358388 s does not show a pulsar signal, but 0.35877 s is the pulsar | Phase diagram of B1933+16 with a period of 0.35877 s |

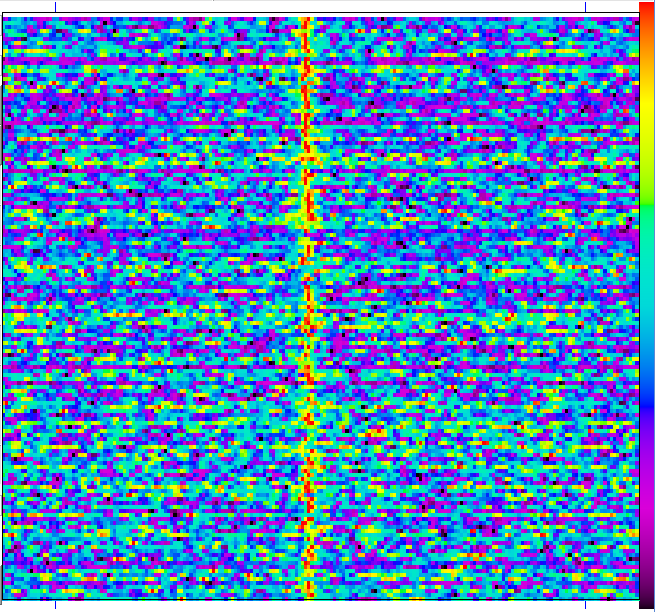
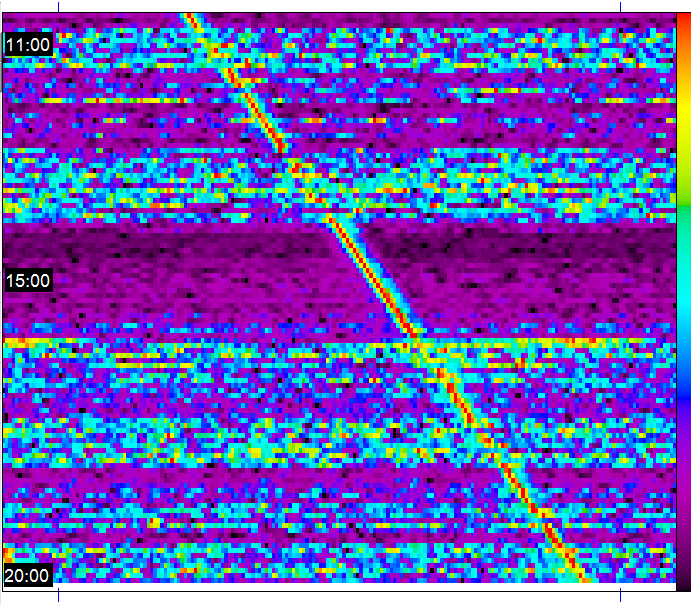
This causes the signal from the normally bright pulsar B0329+54 to become much fainter for times, which makes testing and optimising the receiving system quite challenging. Here is a waterfall showing what happened during 10 hours on 26 oct 2015: for one hour around UT 15:00 the pulsar B0329+54 was exceptionally strong. At other times it changed between a reasonably good signal and being buried in the noise. Although this diagram is done with too short a period, which causes the line of the pulses to drift to the right, one can easily follow the coming and going of the signal:
B0329+54 can be used to study scintillation, by continously measuring its signal, and
observing the time variation of the strength of the pulse with respect to the noise.
This is done for several days in autumn 2015, during which all instrumental details
are kept unchanged. The data is sampled at 40 kHz, but averaged over 80 data points,
so that the data are recorded with a rate of 500 Hz, which makes smaller file lengths.
From 1 minute sections of the raw data, phase diagrams are computed and the ratio of the
height of the highest peak to the standard deviation of the background around this maximum
is taken as the signal to noise ratio.
From the entire data set the strong variation of the signal to noise ratio is apparent.
It can vary between about 20 to close to 1.
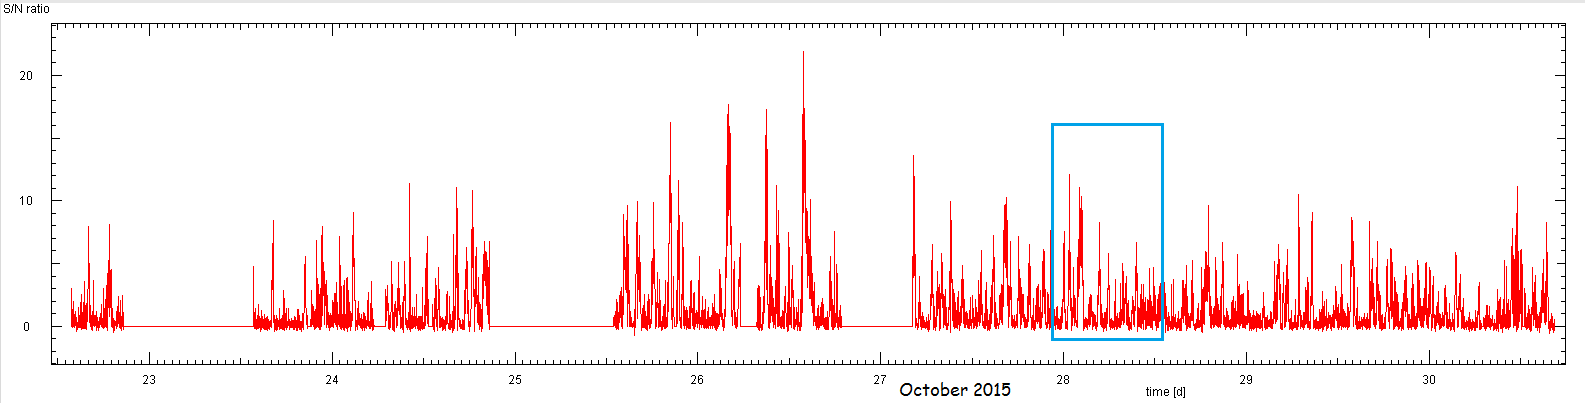
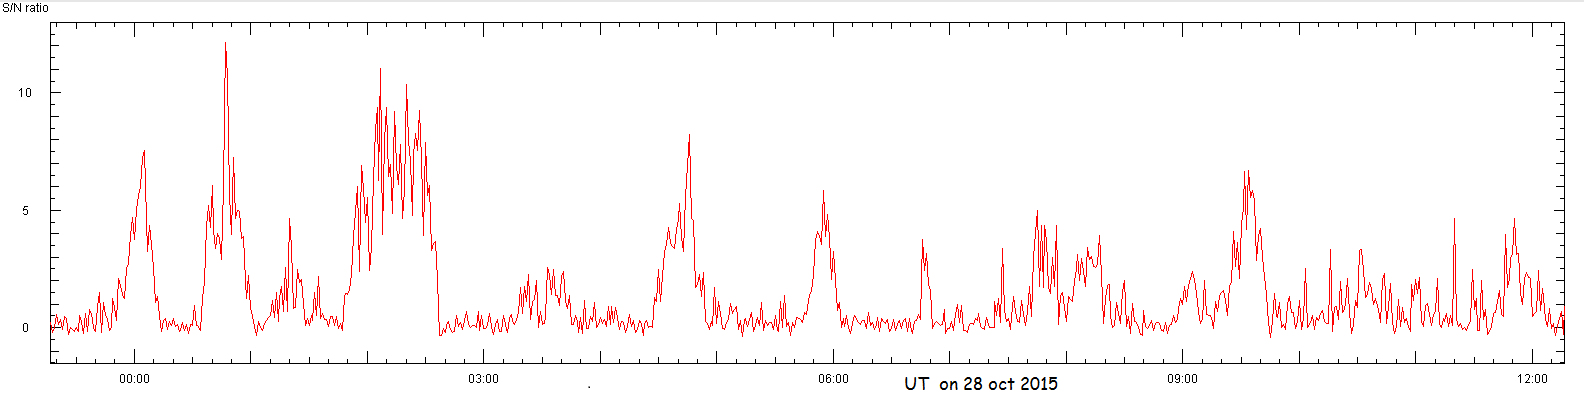
During a time span of 12 hours, the pulse may be present for a few minutes or as long as an hour, only to suddenly disappear in the noise.

|

|
The autocorrelation function of the entire data set. The width of the peak at zero time offset shows that the average duration of an interval of high signal to noise ratio is less than 30 min. Also, the peaks at 5 and 7.5 hours time offset indicat that there is a slight chance to have another stretch of strong pulses after 5 or 7.5 hours. As these peaks a very low, it means that there is no periodicity in the occurrence of good pulsar receptions. | The cumulative distribution function of the signal to noise ratio in the entire data set. It shows that conditions with high S/N ratio are very rare occasions ... this diagram may permit some interpretation of the signal level fluctuations and their nature (work to be done!) |