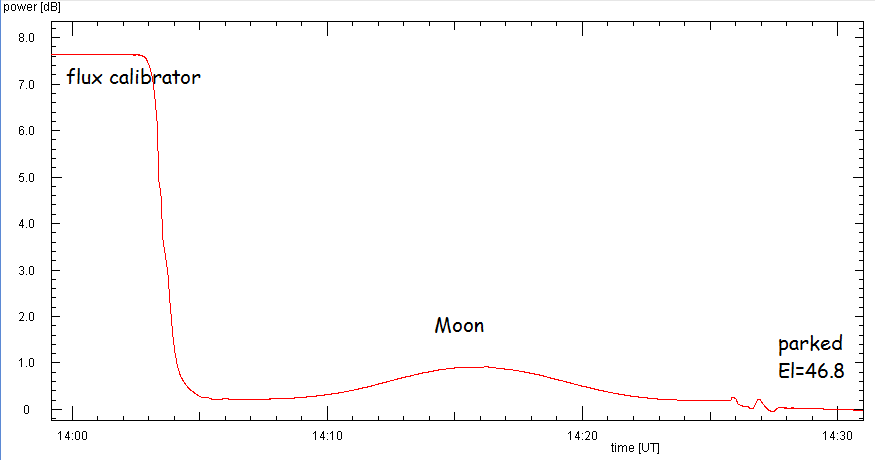
The example shows a driftscan on 1.3 GHz. The lunar signal is only 0.7 dB above the background noise and substantially weaker than the calibrator. Subsequently, the sky background profile was taken.
On 24 GHz we first searched for the best lunar position, then the antenna was slightly moved to the west, so that after switching off the tracking the Moon drifted through the antenna's main lobe. After the level from the 'empty' sky became constant, the flux calibration and a complete profile of the sky background was measured. One notes that on this frequency the Moon is substantially brighter than on 1.3 GHz.
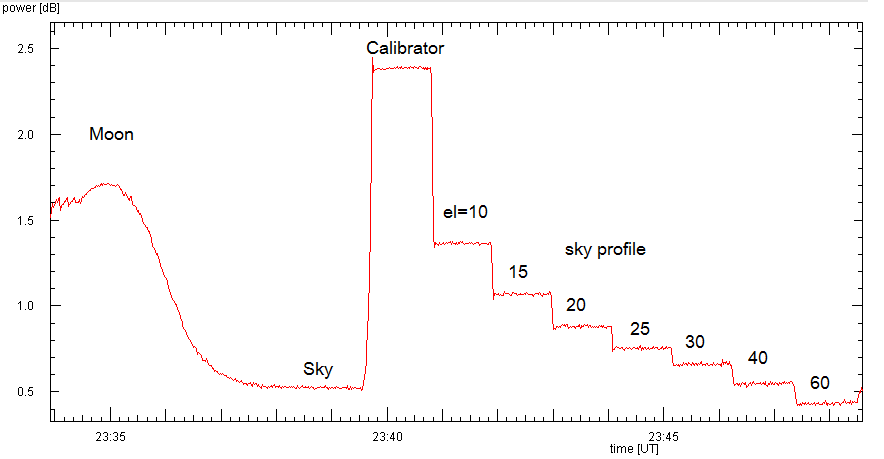
On 24 GHz (system temperature about 400 K) one gets an antenna temperature of about 100..120 K. Because of the narrow antenna beam of 0.2° this is equal to the temperature on the Moon. However, this is not yet corrected for the attenuation by the Earth atmosphere, and results in a substantially lower value than the average lunar temperature of 240 K.
Below is a plot of the computed radio flux on 1.3 GHz for the first three months in 2015. The changing Earth-Moon distances are taken into account, as well as a simple model for the variation of the surface temperature with the lunar phase.

Since the main interest is to detect any variation of the radio flux during the eclipse, the procedure is quite simple: The Moon is tracked by the 1.3, 8, 10, and 24 GHz antennas and the radio fluxes are continuously recorded. Observation starts shortly after moon rise, as to have a good amount of data from the unobscured Moon, from which it is possible to judge the level of signal variations due to the receiver electronics and the sky. Fortunately, during the entire nights, the sky remains clear without a single cloud.
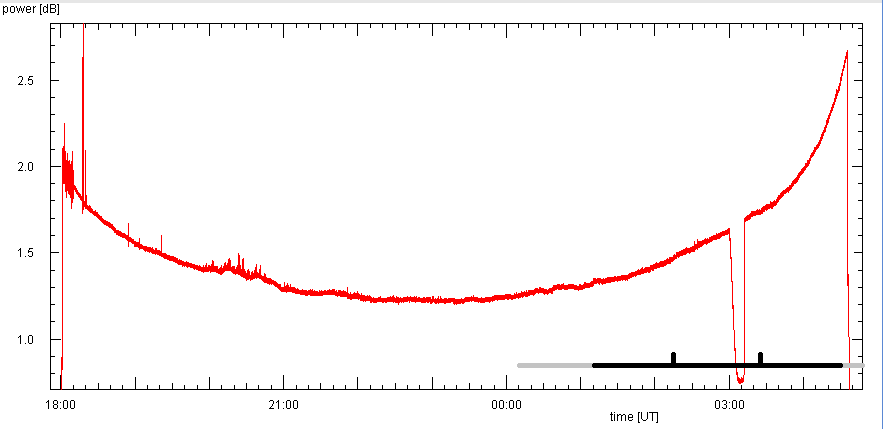
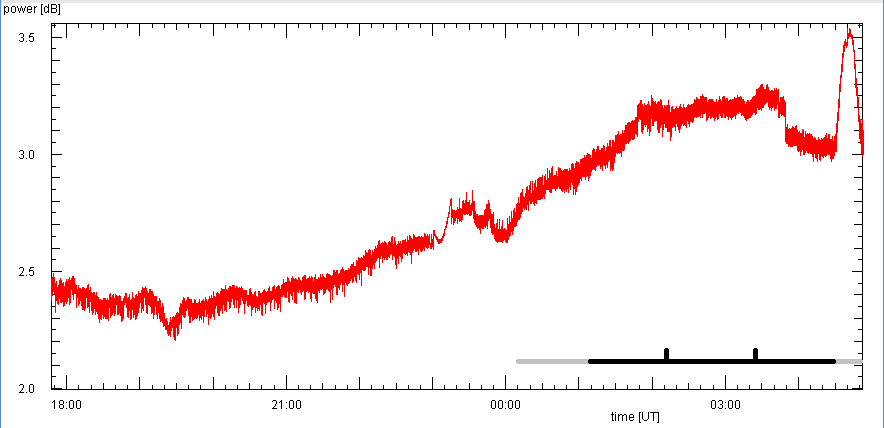
Signal level recorded on 1.3 GHz: The grey horizontal bar indicates the time during which the Moon is in the penumbra, the black bar when it is in touch with the core shadow. The two black ticks mark the interval when the Moon is fully in the core shadow. Since this antenna has a rather broad beam of 1.8° and also important sidelobes, the signal level is high in the beginning and at the end due to pick-up of ground radiation. Near the start there are a few perturbations, like a short high peak probably due to a bird.
Throughout the eclipse, the signal level does not show any significant variation, except for the systematic increase from the ground pick-up. At 03:00 UT the tracking stops by chance. As it takes some time to restore tracking, the antenna points to the empty sky and measures the sky noise. This gives a Moon/Sky contrast of 1.03 dB, which is as expected with this antenna.
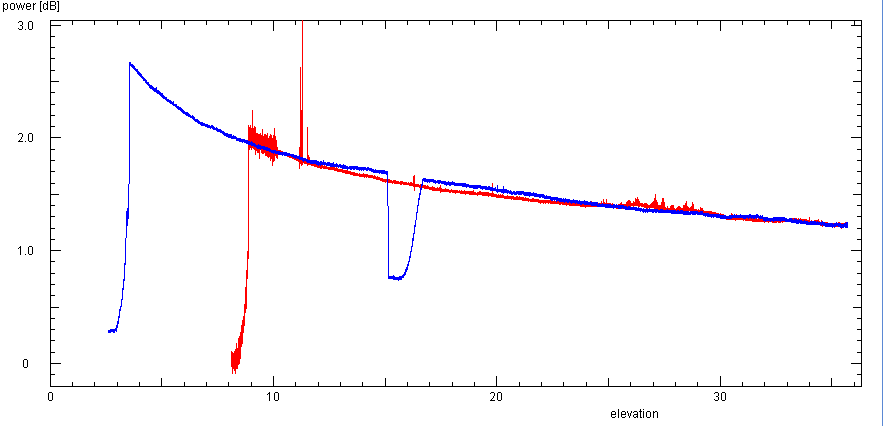
The signal level decreases in the eastern part (red) of the Moon's path in the same way as it increases in the western part (blue). The slight (0.1 dB) increase of the level in the western part is not caused by the eclipse, but is evidently due to changes in the receiver electronics or the atmosphere.
Unfortunately no data are stored. But frequent inspections during the night show no signal variations, apart from a few small sudden changes, due to the bending of coaxial cables.
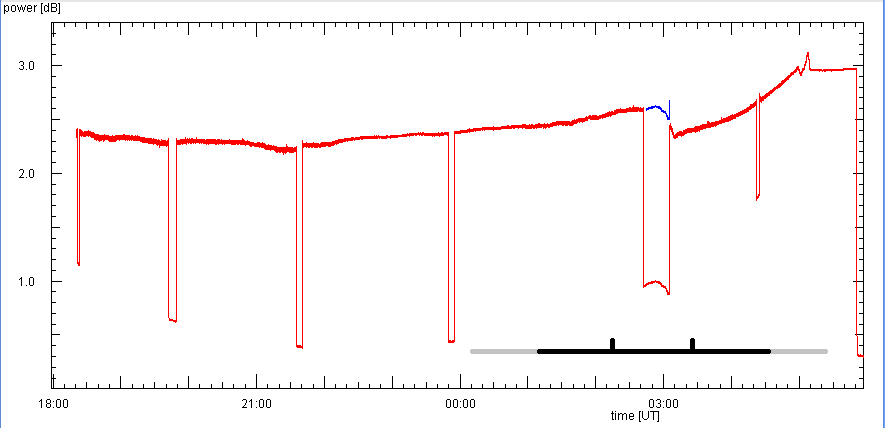
The level measured on 10 GHz shows a somewhat systematic increase. As on this frequency thermal emission from the atmosphere is quite important, this may be due to a change in the atmosphere, but could also be a variation of the receiver noise as the electronics cools off during the night. In any case, there is no relation with the lunar eclipse. In particular, there is no reaction – in the form of a drop in signal – which starts when the Moon enters the core shadow near 02:15 UT! The sudden drop in level at 03:50 UT is clearly an instrumental effect. The rise near the end of the recording is due to the antenna pointing into some trees to the west.
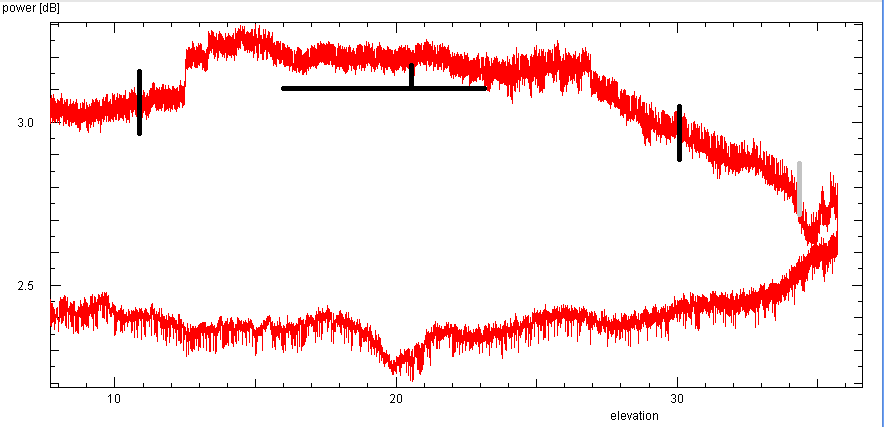
The dependence of the signal level with elevation. The vertical ticks mark the first contact (grey), entering and leaving the core shadow (black). The horizontal black line indicates the time when the Moon is fully covered by the core shadow, the vertical tick marks maximum eclipse. It is apparent that there is no change of the level with elevation. At 10 GHz atmospheric absorption may also be neglected. There is no change that can be associated with the eclipse.
As atmospheric absorption is important on 24 GHz, the antenna is shifted at regular intervals by 5° east of the Moon to measure the sky noise. There is a slight overall fall and rise of the signal level by the increase of atmospheric thermal emission at low elevations. At 02:40 UT, near maximum eclipse, one of these sky noise measurements are taken. By chance there occurs a substantial variation of the signal level, resulting in an overall drop by about 0.2 dB. However, this is a purely instrumental effect, because the change is present in the measurement of the empty sky: If one copies this part of the curve and places it at the part representing the lunar measurements, one finds that this piece (blue in the above figure) matches very neatly the evolution of the lunar signal. Therefore, the lunar radio emission on 24 GHz does not change during the eclipse .

The data taken at the Moon and the sky nearby (red curve) can be used to determine the atmospheric conditions. The green curve is the dependence of the sky noise with elevation predicted by a simple atmospheric model. The blue curve is the match of the lunar radio fluxes. The blue numbers on top give the elevations for the abscissa, which is in airmass = 1/sin(elevation).
Adopting a system temperature of 200 K from previous measurements, and assuming a plane-parallel layer of air at temperature 290 K, one finds that the measured dependence of sky noise on elevation can well be matched by a zenith absorption of 0.47 dB, corresponding to a zenith temperature of 30 K. Both values are in good agreement with previous observations for clear sky conditions. The lunar fluxes yield a lunar antenna temperature of 175 K.
Yet, a question remains: The very top layer of the lunar soil does change its temperature during an eclipse,
as found by in-situ measurements from Apollo missions. Since the emission on 24 GHz originates from the
top layer (perhaps 1 cm), why is no changes measured? Piddington and Minnett did their measurements
of the time delay of the lunar temperature also on 24 GHz. Evidently this frequency is not yet high
enough to sample the uppermost layer. What would be the expected change in radio flux?
This can be computed from a model of the lunar soil, as it is heated up by solar radiation:
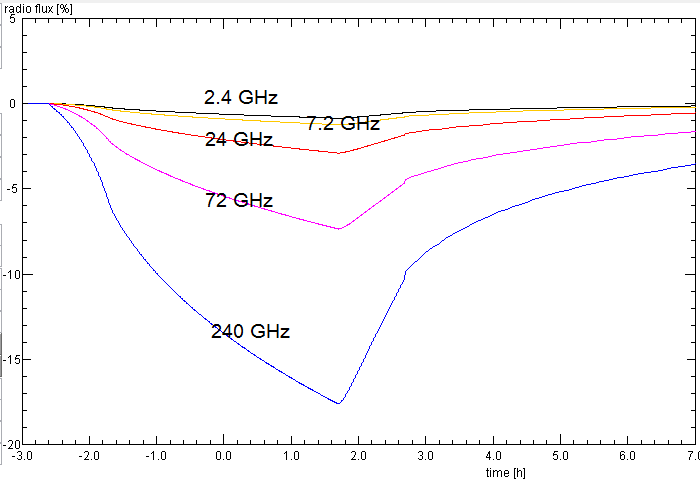
The predicted drop of the radio flux at several frequencies from the Moon during a total lunar
eclipse, given in percentages of the flux at Full Moon.
The maximum of the eclipse occurs at time = 0.
|
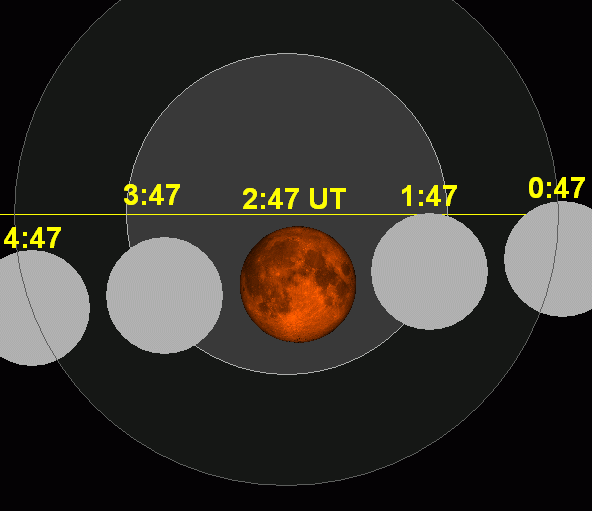
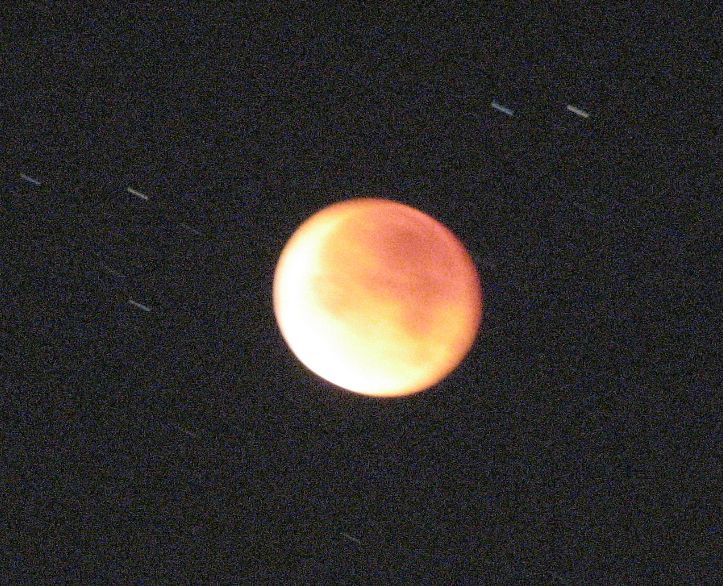
The Moon near maximum eclipse. Due to the 15 s long exposure the Moon is blurred and trails of background stars can be seen. |
|
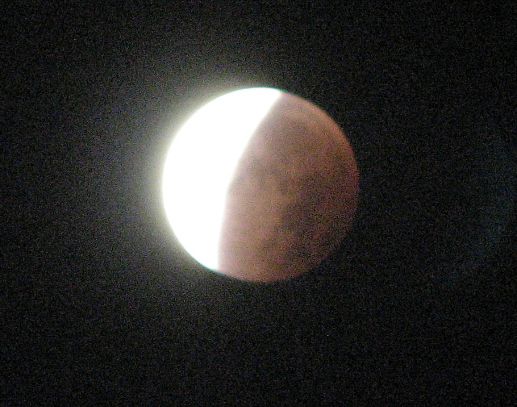
The Moon after coming out of the core shadow. The exposure time is set to show at least something of the dark side, so the bright side is overexposed. |
|
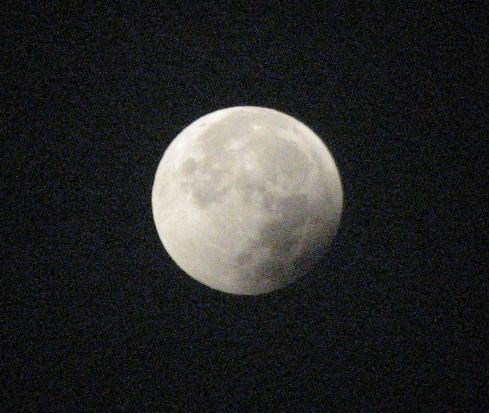
The Moon before leaving the penumbra. |